Transformando dados em resultados

Na OSI Tech, unimos tecnologia e estratégia digital para impulsionar o crescimento de empresas locais e regionais com soluções personalizadas e focadas em performance.

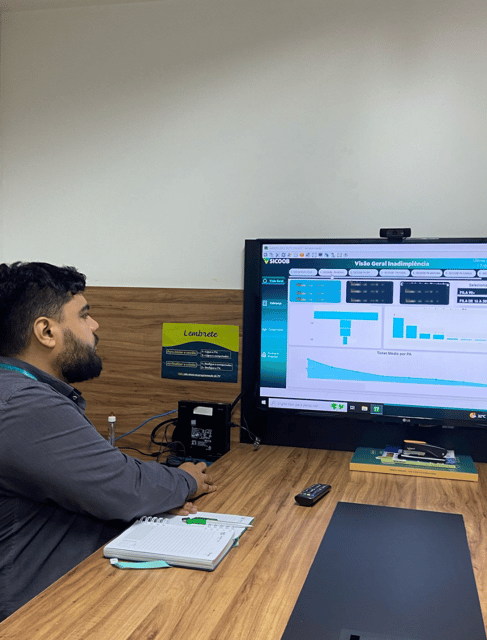
Com nossos sistemas e dashboards, você pode monitorar todos os setores da sua empresa — financeiro, produção, vendas, estoque, atendimentos e muito mais — em tempo real e de forma integrada.

Transformamos informações brutas em indicadores claros e acionáveis, que ajudam você a tomar decisões mais rápidas, reduzir custos, identificar gargalos e aproveitar oportunidades de crescimento.

Nossas soluções combinam:

  • Dashboards inteligentes em Power BI

  • Automação de relatórios e processos

  • Integração com bancos de dados, ERPs e sistemas internos

  • Alertas estratégicos para acompanhar metas, desempenho e resultados

Tudo isso com visual moderno, de fácil leitura e adaptado à realidade do seu negócio. Você não precisa ser um especialista para entender os números — nós traduzimos os dados em decisões práticas que geram lucro e crescimento.

Seus dados já têm as respostas. A OSI Tech te mostra como usá-los.

Projetos Inovadores

Transformamos dados em estratégias digitais de alto impacto.

A man in a suit is working at a desk with a dual-monitor setup showing SEO presentation slides and data charts. The office environment is bright, with natural light coming from a nearby window, and a Rubik's cube is placed in front of the monitor.
Análise de Dados

Relatórios e dashboards personalizados para sua empresa.

Two laptops display dark-themed screens; one shows analytical graphs and statistics, including conversion rates, store sessions, and geographic distribution. The other screen displays a grid of web application icons. The scene is dimly lit, emphasizing the glow from the screens and the softly illuminated keyboards.
A graphic with text reading 'Exploring Opportunities for D2C Startups in the Post-COVID-19 World.' It features a target with an arrow, a computer monitor displaying an upward graph, a calendar, a rocket icon, and a clipboard with colorful sticky notes.
A person is viewing a map with red data points on a computer monitor, likely indicating a geographical distribution. The image has a focus on technology and data analysis.
Automação Eficiente

Otimização de processos para aumentar a produtividade operacional.